Life Cycle Assessment of Perfect Day Protein

Goals
Perfect Day is at the forefront of precision fermentation technology with a novel approach to making whey protein that is both efficient and scalable. The company commissioned this study to determine the total greenhouse gas (GHG) emissions, primary energy demand, and blue water consumption from the lifecycle of the company’s animal-free dairy proteins and to compare these environmental impacts to those of bovine dairy protein.
The goal of this process was twofold: (1) to understand Perfect Day’s current greenhouse gas emissions, non-renewable energy use, and blue water consumption, compared to traditional production methods, and (2) to identify potential areas for improvement.
Whey Protein Findings
This study found that, compared to the total protein in milk, Perfect Day whey protein is:
- 91% to 97% lower in GHG emissions
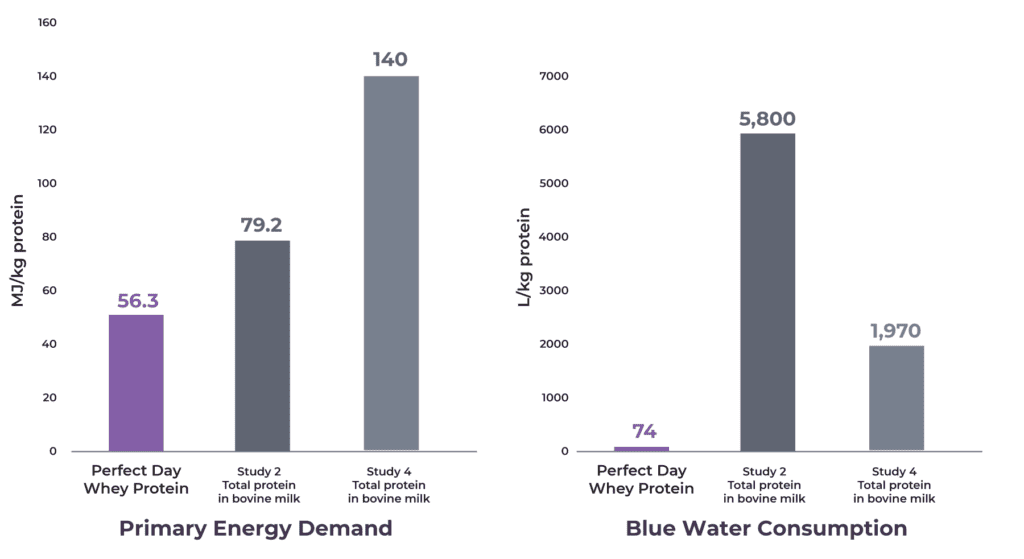
- 29% to 60% lower energy demand
- 96% to 99% lower blue water consumption
According to the United Nations Food and Agriculture Organization, the US produces 97,787,000 [Metric] tonnes of milk annually, excluding butter. If US consumers switched entirely to Perfect Day whey protein, this would save up to 246 million tons of CO2e emissions, which is the equivalent of up to 28 million homes’ energy use for one year (all the homes in New York and California combined) or up to 53 million passenger vehicles driven for one year (all the cars in NY, CA, TX, and FL combined). The same amount of milk would require 32% of the total lighting energy consumed by US residential and commercial sectors and the amount of water needed by 187 billion people for the daily indoor home use. Therefore, deriving non-animal whey protein from Perfect Day rather than bovine dairy would lead to a reduction of approximately 18,600 billion gallons of water and 75 billion MJ energy use.
The graph below details the primary findings on the environmental impacts of Perfect Day whey protein compared to total protein in bovine milk per kg protein:
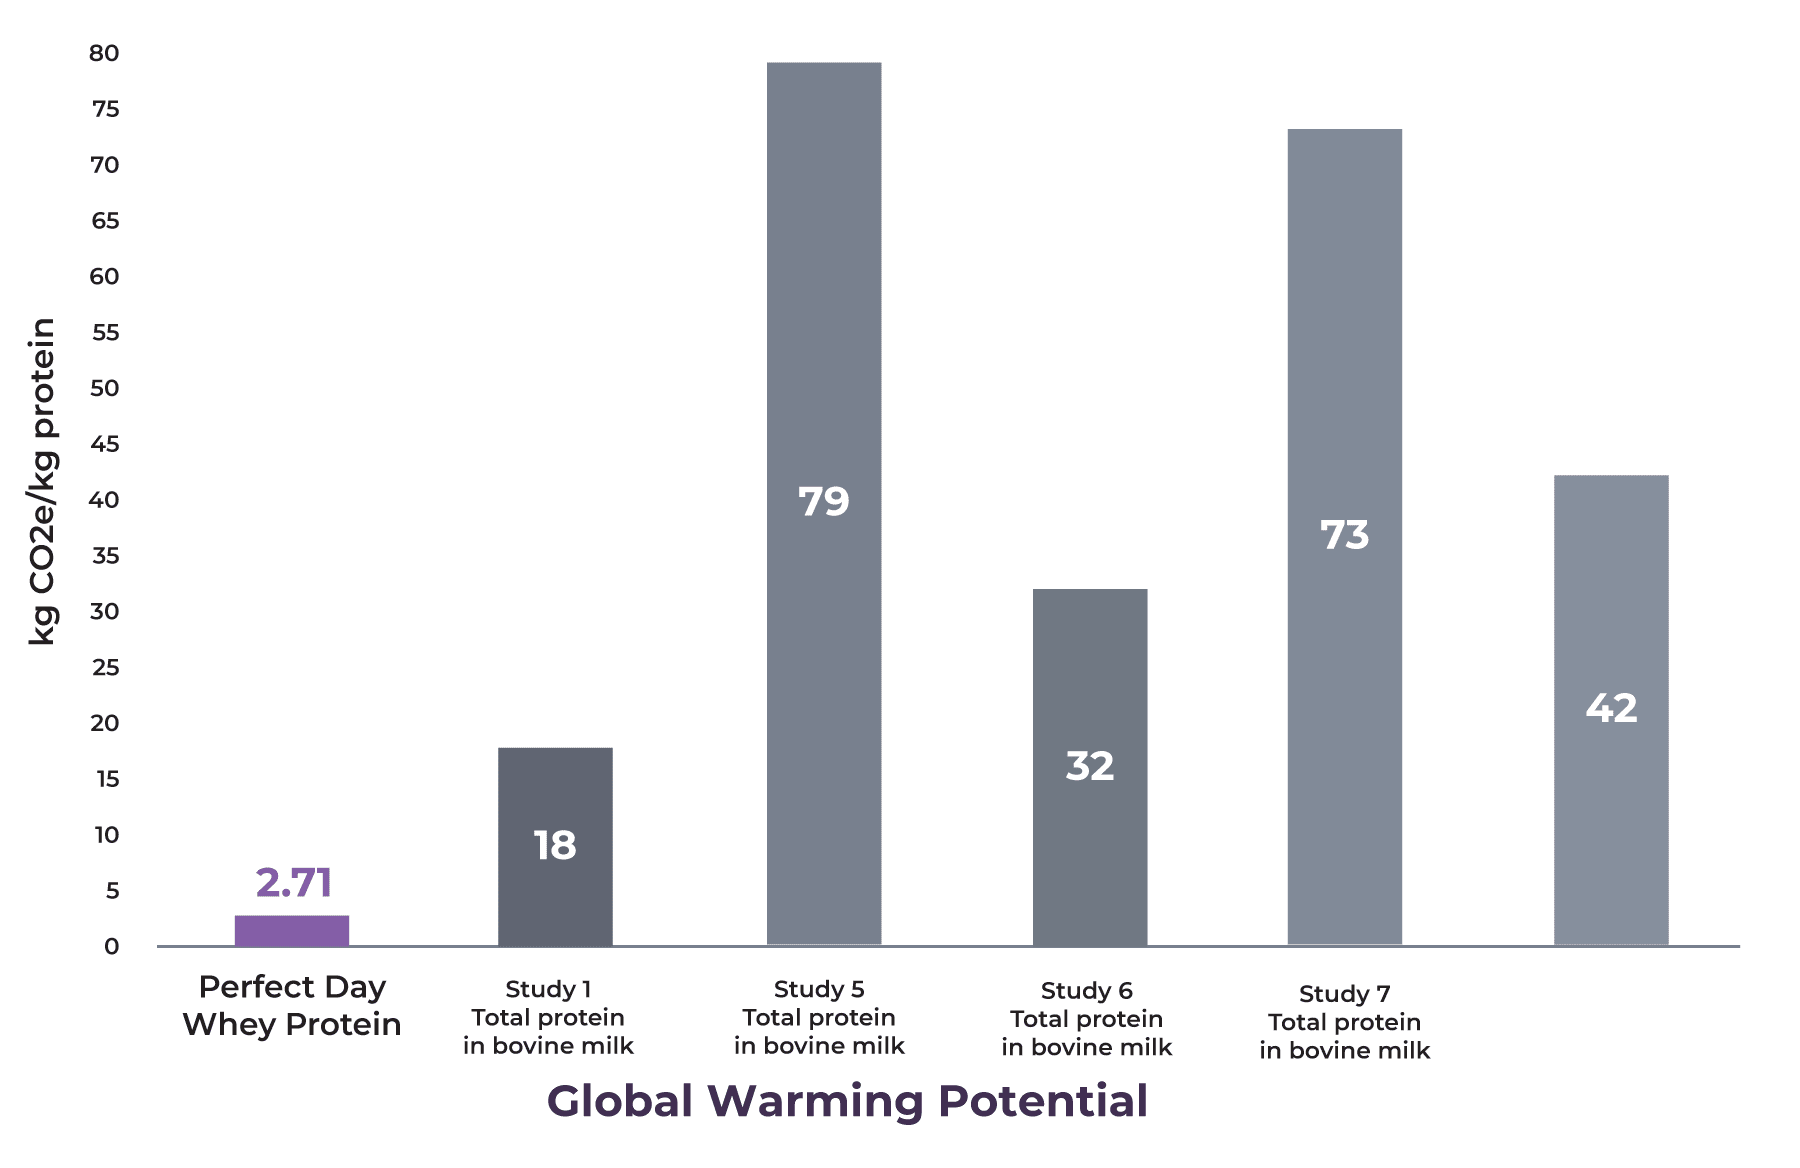
This graph shows emissions from Perfect Day whey protein compared to total amount of protein found in cow’s milk, or “total protein in milk,” using two examples with 3.3% total protein in milk content, four with 3.4% total protein in milk content, and one with 2.8% total protein in milk content.
ISO Review
The study was critically reviewed by a three-person panel of independent experts in conformance with ISO Standard 14067 on GHG emissions. The reviewers’ findings are summarized in the verification statement at the end of the report (see link to download the full report at the bottom of this page). The Global Warming Potential (GWP) was assessed using the Intergovernmental Panel on Climate Change’s (IPCC) Fifth Assessment Report (AR5) 100-year time scale excluding biogenic carbon method. The low heating value (LHV or net calorific value), reported in megajoules (MJ), was used to determine the primary energy from non-renewable resources as a measurement of energy use from fossil resources that cannot be replenished. Blue water consumption (BWC) was quantified to capture the amount of water consumed by the system, not just the total withdrawals. This metric is measured in kilograms (kg) or liters (L) of water by determining the total amount of water withdrawn from and not returned to surface and ground water sources.
Life Cycle Assessment Method
The Life Cycle Assessment method was used to aid Perfect Day in understanding hotspots and drivers of GHG emissions, primary energy demand (non-renewable), and blue water consumption from its whey protein production as well as how those impacts compare to those of the total amount of protein found in cow’s milk, referred to as “total protein in milk,” using:
- Two examples with 3.3% total protein in milk content
- Four with 3.4% total protein in milk content
- One with 2.8% total protein in milk content
The seven different studies were chosen to show the range of potential results.
The environmental impacts selected for this study were chosen to provide the most value to Perfect Day in its commitment to measuring, communicating, and improving its environmental impact. The function of the product is to be a provider of protein; therefore, the functional unit of the product is a measure of this nutritional aspect: one kilogram (kg) of protein in the product.
The environmental impact from different proteins depends on material inputs, production method, location, and transportation of the inputs. Perfect Day wanted to fully understand its impact; therefore, the analysis was conducted from cradle-to-gate to include the upstream production of the materials and materials used for the Perfect Day process, such as corn grain for sugar production, production of all other inputs to the process (e.g., natural gas and electricity), and transportation of materials to the Perfect Day production facility. Perfect Day whey protein production also yields a solid biomass co-product that can be sold as an ingredient in high-value domesticated animal pet food; therefore, mass allocation was applied to apportion the environmental impacts between the primary and co-product.
Notes
The primary driver of GHG emissions for Perfect Day whey protein is the utilities, which contribute 40% of its total GHG emissions. Utilities are the largest contributor to GHG emissions due to the composition of the US electric grid, which consists primarily of coal (31%), and natural gas (33%). Following utilities, the protein development (fermentation) phase contributes 25% to total GHG emissions, due to the production of glucose via starch hydrolysis.. Glucose production contributes 83% to the emissions from the protein development phase. The primary driver of energy is also utilities, which include the US average natural gas and electricity used in the protein production process. For blue water consumption, the starch hydrolysis to produce glucose is the primary driver, with corn production being a major contributor.
It is important to note that there is no single study that explores all of these different environmental impacts. Hence, a combination of studies is used to compare the Perfect Day results to total protein in milk.
The application of the results, interpretation, and conclusions of this study are limited to the proteins considered in this study. Furthermore, the results calculated for Perfect Day whey protein are limited to its unique technology and cannot be extrapolated or applied to the production of non-animal-based dairy protein by other means.
We’d love to hear your thoughts!
Your email address will not be shared.